SpectralRadiance
- class kgpy.observatories.iris.spectrograph.SpectralRadiance(input, output=None, mask=None, in_south_atlantic_anomaly=None)
Bases:
SpectralRadiance[TemporalOffsetSpectralFieldVector[Array,Array,WorldCoordinateSpace,WorldCoordinateSpace,WorldCoordinateSpace],Array]- Parameters:
input (InputT) –
output (OutputT) –
mask (int | float | ndarray | Quantity | AbstractArray | AbstractArray | None) –
in_south_atlantic_anomaly (int | float | ndarray | Quantity | AbstractArray) –
- __init__(input, output=None, mask=None, in_south_atlantic_anomaly=None)
- Parameters:
input (InputT) –
output (OutputT | None) –
mask (int | float | ndarray | Quantity | AbstractArray | AbstractArray | None) –
in_south_atlantic_anomaly (int | float | ndarray | Quantity | AbstractArray | None) –
- Return type:
None
Attributes
Methods
__init__(input[, output, mask, ...])archive_url_list_from_query_hek(query_hek)- rtype:
list[urlpath.URL]
copy()- rtype:
typing.TypeVar(CopyableT, bound= Copyable)
- rtype:
typing.TypeVar(CopyableT, bound= Copyable)
folder_from_archive(archive)- rtype:
from_archive_path_array(archive_path_array)- rtype:
typing.TypeVar(SpectralRadianceT, bound= SpectralRadiance)
from_archive_url_array(archive_url_array[, ...])- rtype:
SpectralRadianceT
from_fits_path_array(fits_path_array[, ...])- rtype:
typing.TypeVar(SpectralRadianceT, bound= SpectralRadiance)
from_pickle([path])from_query_hek(query_hek[, ...])- rtype:
SpectralRadianceT
from_time_range([time_start, time_stop, ...])interp_barycentric_linear(input_new[, axis, ...])Interpolate this function using barycentric interpolation.
interp_barycentric_linear_scipy(input_new)- rtype:
typing.TypeVar(ArrayT, bound= Array)
interp_linear(input_new[, axis, damping])- rtype:
typing.TypeVar(ArrayT, bound= Array)
interp_nearest(input_new[, axis])- rtype:
typing.TypeVar(ArrayT, bound= Array)
pcolormesh(axs, input_component_x, ...[, ...])Plot this function using
matplotlib.pyplot.pcolormesh.query_hek_from_time_range([time_start, ...])to_pickle(path)zeros(shape[, axis_wavelength_offset, ...])- rtype:
typing.Self
Inheritance Diagram
digraph inheritance2d0a980059 { bgcolor=transparent; rankdir=TB; size="8.0, 12.0"; "abc.ABC" [URL="https://docs.python.org/3/library/abc.html#abc.ABC",fillcolor=white,fontname="Vera Sans, DejaVu Sans, Liberation Sans, Arial, Helvetica, sans",fontsize=10,height=0.25,shape=box,style="setlinewidth(0.5),filled",target="_top",tooltip="Helper class that provides a standard way to create an ABC using"]; "kgpy.function.AbstractArray" [URL="kgpy.function.AbstractArray.html#kgpy.function.AbstractArray",fillcolor=white,fontname="Vera Sans, DejaVu Sans, Liberation Sans, Arial, Helvetica, sans",fontsize=10,height=0.25,shape=box,style="setlinewidth(0.5),filled",target="_top",tooltip="AbstractArray(input: ~InputT)"]; "kgpy.mixin.Pickleable" -> "kgpy.function.AbstractArray" [arrowsize=0.5,style="setlinewidth(0.5)"]; "kgpy.mixin.Copyable" -> "kgpy.function.AbstractArray" [arrowsize=0.5,style="setlinewidth(0.5)"]; "abc.ABC" -> "kgpy.function.AbstractArray" [arrowsize=0.5,style="setlinewidth(0.5)"]; "typing.Generic" -> "kgpy.function.AbstractArray" [arrowsize=0.5,style="setlinewidth(0.5)"]; "kgpy.function.Array" [URL="kgpy.function.Array.html#kgpy.function.Array",fillcolor=white,fontname="Vera Sans, DejaVu Sans, Liberation Sans, Arial, Helvetica, sans",fontsize=10,height=0.25,shape=box,style="setlinewidth(0.5),filled",target="_top",tooltip="Array(input: ~InputT, output: ~OutputT = None, mask: Union[int, float, numpy.ndarray, astropy.units.quantity.Quantity, kgpy.labeled.AbstractArray, kgpy.uncertainty.AbstractArray, NoneType] = None)"]; "kgpy.function.AbstractArray" -> "kgpy.function.Array" [arrowsize=0.5,style="setlinewidth(0.5)"]; "kgpy.mixin.Copyable" [URL="kgpy.mixin.Copyable.html#kgpy.mixin.Copyable",fillcolor=white,fontname="Vera Sans, DejaVu Sans, Liberation Sans, Arial, Helvetica, sans",fontsize=10,height=0.25,shape=box,style="setlinewidth(0.5),filled",target="_top"]; "abc.ABC" -> "kgpy.mixin.Copyable" [arrowsize=0.5,style="setlinewidth(0.5)"]; "kgpy.mixin.Pickleable" [URL="kgpy.mixin.Pickleable.html#kgpy.mixin.Pickleable",fillcolor=white,fontname="Vera Sans, DejaVu Sans, Liberation Sans, Arial, Helvetica, sans",fontsize=10,height=0.25,shape=box,style="setlinewidth(0.5),filled",target="_top",tooltip="Class for adding 'to_pickle' and 'from_pickle' methods for objects with long creation times."]; "abc.ABC" -> "kgpy.mixin.Pickleable" [arrowsize=0.5,style="setlinewidth(0.5)"]; "kgpy.observatories.iris.spectrograph.SpectralRadiance" [URL="kgpy.observatories.iris.spectrograph.SpectralRadiance.html#kgpy.observatories.iris.spectrograph.SpectralRadiance",fillcolor=white,fontname="Vera Sans, DejaVu Sans, Liberation Sans, Arial, Helvetica, sans",fontsize=10,height=0.25,shape=box,style="setlinewidth(0.5),filled",target="_top",tooltip="SpectralRadiance(input: ~InputT, output: ~OutputT = None, mask: Union[int, float, numpy.ndarray, astropy.units.quantity.Quantity, kgpy.labeled.AbstractArray, kgpy.uncertainty.AbstractArray, NoneType] = None, in_south_atlantic_anomaly: 'kgpy.labeled.ArrayLike' = None)"]; "kgpy.solar.SpectralRadiance" -> "kgpy.observatories.iris.spectrograph.SpectralRadiance" [arrowsize=0.5,style="setlinewidth(0.5)"]; "kgpy.solar.SpectralRadiance" [URL="kgpy.solar.SpectralRadiance.html#kgpy.solar.SpectralRadiance",fillcolor=white,fontname="Vera Sans, DejaVu Sans, Liberation Sans, Arial, Helvetica, sans",fontsize=10,height=0.25,shape=box,style="setlinewidth(0.5),filled",target="_top",tooltip="SpectralRadiance(input: ~InputT, output: ~OutputT = None, mask: Union[int, float, numpy.ndarray, astropy.units.quantity.Quantity, kgpy.labeled.AbstractArray, kgpy.uncertainty.AbstractArray, NoneType] = None)"]; "kgpy.function.Array" -> "kgpy.solar.SpectralRadiance" [arrowsize=0.5,style="setlinewidth(0.5)"]; "typing.Generic" [URL="https://docs.python.org/3/library/typing.html#typing.Generic",fillcolor=white,fontname="Vera Sans, DejaVu Sans, Liberation Sans, Arial, Helvetica, sans",fontsize=10,height=0.25,shape=box,style="setlinewidth(0.5),filled",target="_top",tooltip="Abstract base class for generic types."]; }- classmethod archive_path_array_from_archive_url_array(archive_url_array, directory_download=None, use_filament=False)
- Parameters:
archive_url_array (kgpy.labeled.Array[npt.NDArray[urlpath.URL]]) –
directory_download (pathlib.Path | None) –
use_filament (bool) –
- classmethod archive_url_list_from_query_hek(query_hek)
- copy()
- Return type:
typing.TypeVar(CopyableT, bound= Copyable)- Parameters:
self (CopyableT) –
- copy_shallow()
- Return type:
typing.TypeVar(CopyableT, bound= Copyable)- Parameters:
self (CopyableT) –
- classmethod fits_path_array_from_archive_path_array(archive_path_array)
- Return type:
kgpy.labeled.Array[numpy.ndarray[typing.Any,numpy.dtype[pathlib.Path]]]- Parameters:
- classmethod from_archive_path_array(archive_path_array, spectral_window='Si IV 1394', summing_spatial=1)
- classmethod from_archive_url_array(archive_url_array, directory_download=None, spectral_window='Si IV 1394', summing_spatial=1, use_filament=False)
- Return type:
SpectralRadianceT
- Parameters:
archive_url_array (kgpy.labeled.Array[npt.NDArray[urlpath.URL]]) –
directory_download (pathlib.Path | None) –
spectral_window (str) –
summing_spatial (int) –
use_filament (bool) –
- classmethod from_fits_path_array(fits_path_array, spectral_window='Si IV 1394', summing_spatial=1)
- classmethod from_query_hek(query_hek, directory_download=None, spectral_window='Si IV 1394', summing_spatial=1)
- Return type:
SpectralRadianceT
- Parameters:
query_hek (str) –
directory_download (pathlib.Path | None) –
spectral_window (str) –
summing_spatial (int) –
- classmethod from_time_range(time_start=None, time_stop=None, description='', obs_id=None, limit=200, directory_download=None, spectral_window='Si IV 1394', summing_spatial=1)
- Parameters:
time_start (astropy.time.Time | None) –
time_stop (astropy.time.Time | None) –
description (str) –
obs_id (None | int) –
limit (int) –
directory_download (pathlib.Path | None) –
spectral_window (str) –
summing_spatial (int) –
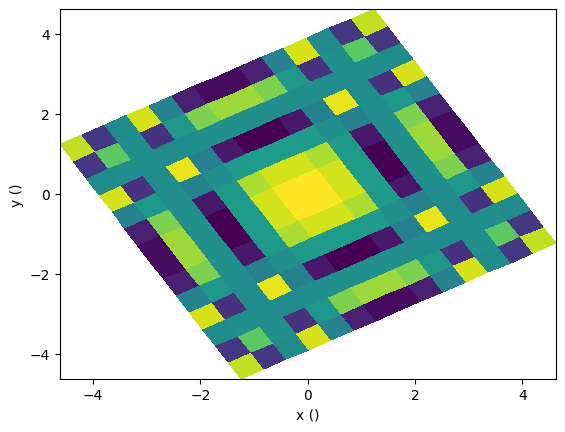
- interp_barycentric_linear(input_new, axis=None, num_kernel=1)
Interpolate this function using barycentric interpolation.
Examples
import numpy as np
import matplotlib.pyplot as plt
import astropy.units as u
import kgpy.labeled
import kgpy.vectors
import kgpy.matrix
import kgpy.function

input = kgpy.vectors.Cartesian2D(
    x=kgpy.labeled.LinearSpace(-np.pi, np.pi, num=14, axis='x'),
    y=kgpy.labeled.LinearSpace(-np.pi, np.pi, num=14, axis='y'),
)

input_rotated = kgpy.matrix.Cartesian2D.rotation(30 * u.deg) @ input

f = kgpy.function.Array(
    input=input_rotated,
    output=np.cos(input.x * input.x * u.rad) * np.cos(input.y * input.y * u.rad),
)

fig, axs = plt.subplots(squeeze=False)
f.pcolormesh(
    axs=axs,
    input_component_x='x',
    input_component_y='y',
)
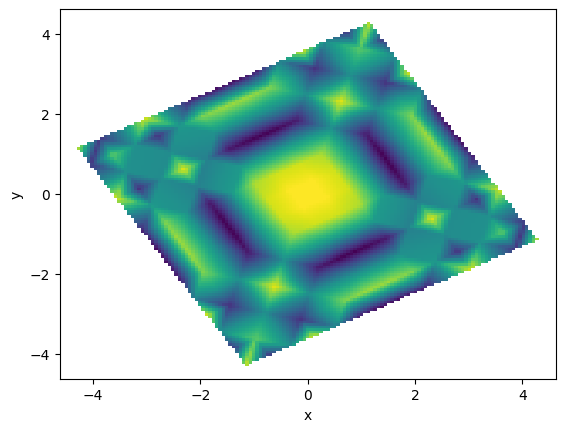
input_large = kgpy.vectors.Cartesian2D(
    x=kgpy.labeled.LinearSpace(-2 * np.pi, 2 * np.pi, num=201, axis='x'),
    y=kgpy.labeled.LinearSpace(-2 * np.pi, 2 * np.pi, num=201, axis='y'),
)

g = f.interp_barycentric_linear(input_large)

fig_large, axs_large = plt.subplots(squeeze=False)
g.pcolormesh(
    axs=axs_large,
    input_component_x='x',
    input_component_y='y',
)
axs_large[0, 0].set_xlim(axs[0, 0].get_xlim());
axs_large[0, 0].set_ylim(axs[0, 0].get_ylim());
- Parameters:
input_new (
typing.TypeVar(InputT, bound=typing.Union[int,float,numpy.ndarray,astropy.units.quantity.Quantity,kgpy.labeled.AbstractArray,kgpy.uncertainty.AbstractArray, VectorInterface])) –self (ArrayT) –
num_kernel (int) –
- Returns:
A new instance of class
- Return type:
kgpy.function.Array evaluated at the coordinates input_new.
- interp_barycentric_linear_scipy(input_new)
- Return type:
typing.TypeVar(ArrayT, bound= Array)- Parameters:
self (ArrayT) –
input_new (InputT) –
- interp_linear(input_new, axis=None, damping=1)
- Return type:
typing.TypeVar(ArrayT, bound= Array)- Parameters:
- interp_nearest(input_new, axis=None)
- Return type:
typing.TypeVar(ArrayT, bound= Array)- Parameters:
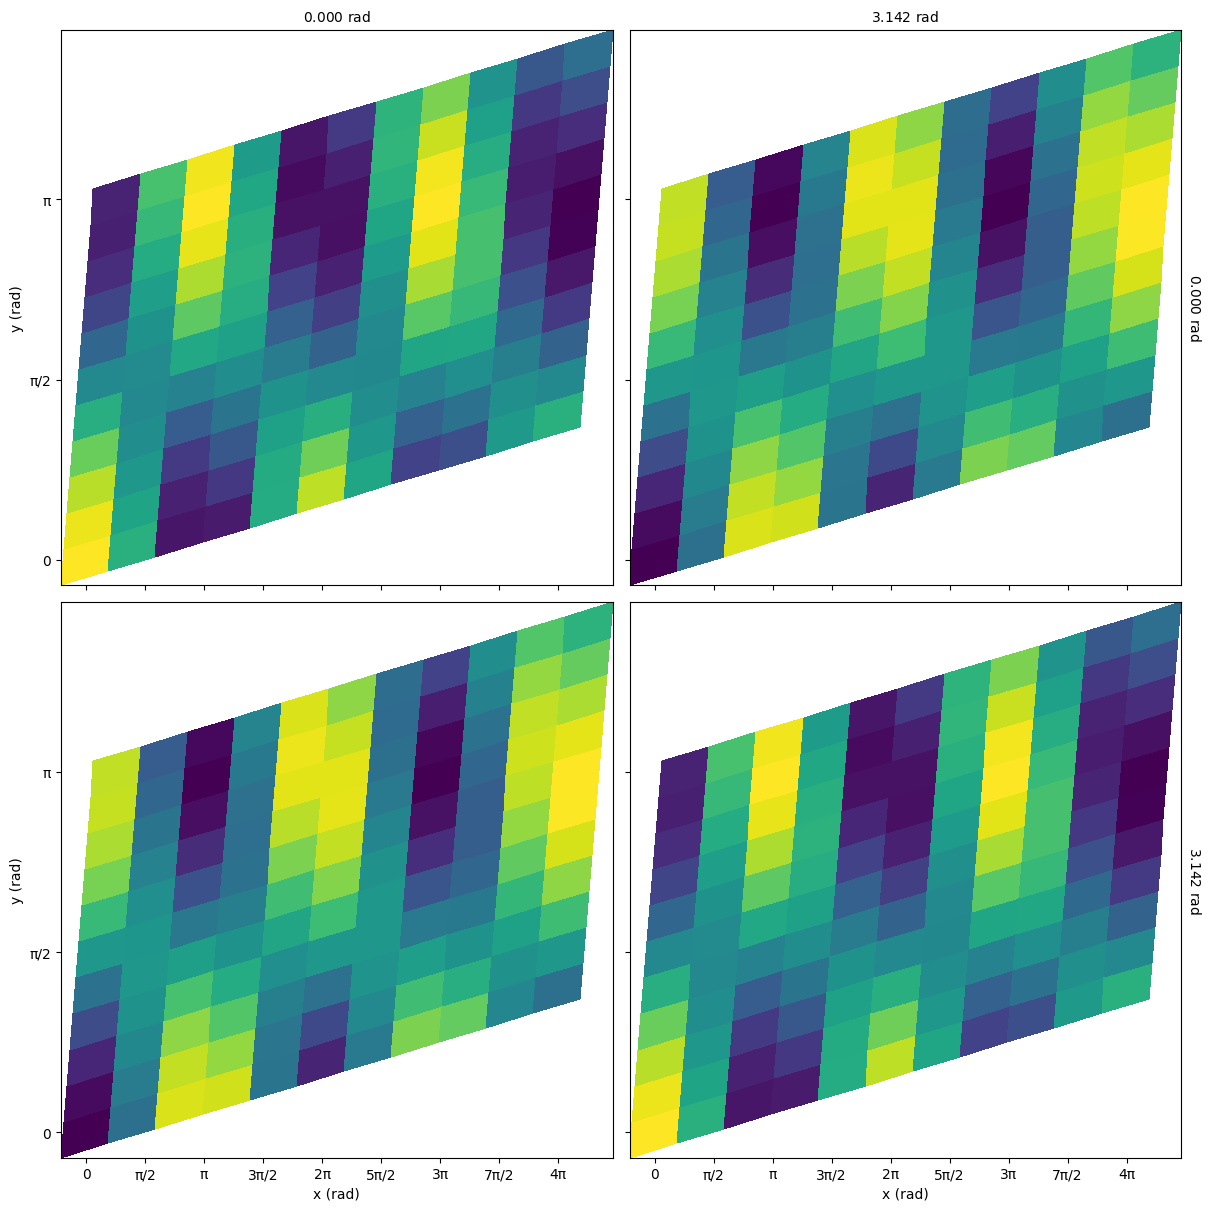
- pcolormesh(axs, input_component_x, input_component_y, input_component_row=None, input_component_column=None, output_component_color=None, index=None, **kwargs)
Plot this function using
matplotlib.pyplot.pcolormesh.Examples
import numpy as np
import matplotlib.pyplot as plt
import astropy.units as u
import kgpy.labeled
import kgpy.vectors
import kgpy.matrix
import kgpy.function

a = kgpy.labeled.LinearSpace(0 * u.rad, np.pi * u.rad, num=2, axis='a')
b = kgpy.labeled.LinearSpace(0 * u.rad, np.pi * u.rad, num=2, axis='b')
x = kgpy.labeled.LinearSpace(0 * u.rad, 2 * np.pi * u.rad, num=11, axis='x')
y = kgpy.labeled.LinearSpace(0 * u.rad, 1 * np.pi * u.rad, num=11, axis='y')

x2 = 2 * x + y / 4
y2 = x / 5 + y

inputs = kgpy.vectors.CartesianND(dict(
    a=a,
    b=b,
    x=x2,
    y=y2,
))

f = kgpy.function.Array(
    input=inputs,
    output=np.cos(a) * np.cos(b) * np.cos(x2) * np.cos(y2),
)

fig, axs = plt.subplots(
    nrows=a.num,
    ncols=b.num,
    sharex=True,
    sharey=True,
    squeeze=False,
    figsize=(12, 12),
    constrained_layout=True,
)

f.pcolormesh(
    axs=axs,
    input_component_x='x',
    input_component_y='y',
    input_component_row='a',
    input_component_column='b',
)
- Parameters:
axs (Array of axes that the function will be plotted on) –
input_component_x (
typing.Union[str,kgpy.vectors.ComponentAxis]) –input_component_y (
typing.Union[str,kgpy.vectors.ComponentAxis]) –input_component_row (
typing.Union[str,kgpy.vectors.ComponentAxis,None]) –input_component_column (
typing.Union[str,kgpy.vectors.ComponentAxis,None]) –output_component_color (
typing.Union[str,kgpy.vectors.ComponentAxis,None]) –index (
typing.Optional[typing.Dict[str,int]]) –kwargs –
self (AbstractArrayT) –
- classmethod query_hek_from_time_range(time_start=None, time_stop=None, description='', obs_id=None, limit=200)
- Parameters:
time_start (astropy.time.Time | None) –
time_stop (astropy.time.Time | None) –
description (str) –
obs_id (None | int) –
limit (int) –
- classmethod zeros(shape, axis_wavelength_offset='wavelength_offset', axis_detector_x='detector_x', axis_detector_y='detector_y')
- in_south_atlantic_anomaly: kgpy.labeled.ArrayLike = None
- input: InputT
- property input_broadcasted: InputT
- mask: typ.Optional[kgpy.uncertainty.ArrayLike] = None
- output: OutputT = None
- property output_broadcasted: OutputT